
Docker writes contents written to stdout and stderr into json formatted log file. If we create a function to write log with specified format like Environment: [DEV], timestamp [class]: contents it’s enough for the log. We don’t have to add logging framework to our app to output our log and learn how to use it. When using Docker, multiple containers are running in many cases and we want to see what’s going on. Combination of Fluentd, Elasticsearch and Kibana helps to see the log. Our applications send log to Docker, and then Docker sends it to Fluentd which enriches the log. The data is stored in Elasticsearch and Kibana visualizes the data.
In this post we will try to setup the environment in following steps.
- Logging to Console
- Logging to a file
- Fluentd as Docker logging driver
- Store log data into Elasticsearch
- Setup Kibana and see the log info
Download the complete source code from here
This is one of Docker learning series posts.
- Start Docker from scratch
- Docker volume
- Bind host directory to Docker container for dev-env
- Communication with other Docker containers
- Run multi Docker containers with compose file
- Container’s dependency check and health check
- Override Docker compose file to have different environments
- Creating a cluster with Docker swarm and handling secrets
- Update and rollback without downtime in swarm mode
- Container optimization
- Visualizing log info with Fluentd, Elasticsearch and Kibana
Logging to Console
Let’s create a very simple application. This is javascript. It just writes log to console.
setInterval(() => {
    const date = new Date();
    const datetime =
        `${date.getFullYear()}-`
        + `${toTwoDigit(date.getMonth())}-`
        + `${toTwoDigit(date.getDate())} `
        + `${toTwoDigit(date.getHours())}:`
        + `${toTwoDigit(date.getMinutes())}:`
        + `${toTwoDigit(date.getSeconds())}.`
        + `${date.getMilliseconds()}`;

    console.log(datetime);
}, 10);

function toTwoDigit(value) {

    return value.toString().padStart(2, "0");
}
Dockerfile looks like this.
FROM yutona/nodejs

CMD node ./src/app.js
COPY ./app.js /src/app.js
Let’s create an image and run it.
$ docker image build -t timewriter ./timewriter/
$ docker container run --rm -d --name timewriter timewriter
$ docker container logs timewriter --tail 5
2020-11-06 11:36:27.927
2020-11-06 11:36:27.937
2020-11-06 11:36:27.947
2020-11-06 11:36:27.958
2020-11-06 11:36:27.968
We can see the log by docker container logs <container name> if the application writes something to stdout. Docker writes the contents to a json file by default and there’s no limit for the size. It means that the container can eat up the pc’s disk. If you want to set the size limit and split the log files you can set it with --log-opt option. Following example sets file size limit to 1KB and number of files to 3.
$ docker container run --rm -d --name timewriter-log --log-opt max-size=1k --log-opt max-file=3 timewriter
# Check where the log file exists in host machine
$ docker container inspect --format="{{.LogPath}}" timewriter-log
/var/lib/docker/containers/36cdceca41a32c2eed57856d3fefe9e9d14f351f7041a0d57385f42fb265c5b2/36cdceca41a32c2eed57856d3fefe9e9d14f351f7041a0d57385f42fb265c5b2-json.log
The json file(s) is created to the host machine but I use Docker-Desktop with Linux container so I can’t see the files because Docker engine is running inside a VM. All log files are inside the VM and I don’t have access to it. I don’t switch to Windows container but you can do if if you want.
Logging to a file
Next application is almost the same as previous one but it writes log to a file. Many applications use logging framework but if it writes to a log file Docker can’t see it. It’s necessary for Docker to read it and output the contents to stdout.
const fs = require("fs");

setInterval(() => {
    const date = new Date();
    const datetime =
        `${date.getFullYear()}-`
        + `${toTwoDigit(date.getMonth())}-`
        + `${toTwoDigit(date.getDate())} `
        + `${toTwoDigit(date.getHours())}:`
        + `${toTwoDigit(date.getMinutes())}:`
        + `${toTwoDigit(date.getSeconds())}.`
        + `${date.getMilliseconds()}`;

    fs.appendFile("/test.log", datetime, (err) => {
        if (err) {
            console.error(err);
        }
    });
}, 10);

function toTwoDigit(value) {
    return value.toString().padStart(2, "0");
}
Let’s run the container.
docker image build -t timewriter2:v1 ./timewriter2/
docker container run --rm -d --name timewriter2-v1 timewriter2:v1
docker container logs timewriter2-v1 --tail 5
No log entry found. We somehow need to read the log file and write them to stdout. I read following post in stackoverflow and tried the way.
Output of tail -f at the end of a docker CMD is not showing
FROM yutona/nodejs

CMD : >> test.log && tail -f test.log && node /src/app.js
COPY ./app.js /src/app.js
However, it didn’t work in my environment. Maybe because I use Docker-Desktop with Linux container. The file specified in the CMD command is a file in the image. I guess when running the container it copies the image and creates new file system for the container. : >> test.log command creates a file in the new file system but the file is in VM because of combination of Docker-Desktop with Linux container.
Anyway, if we want to use Docker logging system we need to create a module to read the log files and write it to stdout. I don’t do that here though.
Fluentd as Docker logging driver

The logs written to stdout are written to json file by default but Docker offers following driver options.
- syslog
- gelf
- fluentd
- awslogs
- splunk
- etwlogs
- gcplogs
- logentries
We can see the logs by docker container logs <container name> when the driver is either default or syslog but not for other drivers. If we run the command for a container which specifies another driver following error message is shown.
$ docker container logs docker-logging_timewriter_1
Error response from daemon: configured logging driver does not support reading
I try to use fluentd and let’s see how the log looks like. I will use following docker-compose.yml file. To use fluentd driver we need to specify it to driver in logging. fluentd is default setting.
version: "3.7"

services:
  timewriter:
    image: timewriter
    depends_on:
      - fluentd
    environment:
      - INTERVAL=5000
    logging:
      driver: "fluentd"
      options:
        tag: "logging-test.{{.ImageName}}"

  random-number:
    image: random-number:v1
    depends_on:
      - fluentd
    environment:
      - INTERVAL=3000
    logging:
      driver: "fluentd"
      options:
        tag: "logging-test.{{.ImageName}}"

  fluentd:
    image: fluent/fluentd:v1.11-1
    volumes:
      - ./fluentd/conf:/fluentd/etc
      - ./fluentd/data:/fluentd/log
    ports:
      - "24224:24224"
      - "24224:24224/udp"
I assigned a volume and log info written to fluentd is written to the file under fluentd/data directory. Let’s run it by docker-compose up -d. Following is my result.
2020-12-07T20:29:17+00:00    logging-test.random-number:v1   {"container_id":"52194d2625f59c7b8e887a550bd78d95847f886ba258c0cd73e1154f3382d46d","container_name":"/docker-logging_random-number_1","source":"stdout","log":"count: 2, value: 2"}
2020-12-07T20:29:20+00:00    logging-test.random-number:v1   {"source":"stdout","log":"count: 3, value: 40","container_id":"52194d2625f59c7b8e887a550bd78d95847f886ba258c0cd73e1154f3382d46d","container_name":"/docker-logging_random-number_1"}
2020-12-07T20:29:21+00:00    logging-test.timewriter {"container_id":"92cf7edc9e675594ff94d32ca3c4e1f443383cb74d3a4c0432e1ac601784f816","container_name":"/docker-logging_timewriter_1","source":"stdout","log":"2020-11-07 20:29:21.599"}
2020-12-07T20:29:23+00:00    logging-test.random-number:v1   {"source":"stdout","log":"count: 4, value: 71","container_id":"52194d2625f59c7b8e887a550bd78d95847f886ba258c0cd73e1154f3382d46d","container_name":"/docker-logging_random-number_1"}
2020-12-07T20:29:26+00:00    logging-test.random-number:v1   {"source":"stdout","log":"count: 5, value: 75","container_id":"52194d2625f59c7b8e887a550bd78d95847f886ba258c0cd73e1154f3382d46d","container_name":"/docker-logging_random-number_1"}
2020-12-07T20:29:26+00:00    logging-test.timewriter {"container_id":"92cf7edc9e675594ff94d32ca3c4e1f443383cb74d3a4c0432e1ac601784f816","container_name":"/docker-logging_timewriter_1","source":"stdout","log":"2020-11-07 20:29:26.603"}
2020-12-07T20:29:29+00:00    logging-test.random-number:v1   {"container_id":"52194d2625f59c7b8e887a550bd78d95847f886ba258c0cd73e1154f3382d46d","container_name":"/docker-logging_random-number_1","source":"stdout","log":"count: 6, value: 49"}
2020-12-07T20:29:31+00:00    logging-test.timewriter {"container_id":"92cf7edc9e675594ff94d32ca3c4e1f443383cb74d3a4c0432e1ac601784f816","container_name":"/docker-logging_timewriter_1","source":"stdout","log":"2020-11-07 20:29:31.609"}
What my apps wrote was just timestamp and random number but fluentd added other info. Those info are specified in default fluent.conf file. When we use fluentd we should create our own configuration file. In this example timestamp info from timewriter is not necessary but we want to output the log to confirm if it’s working. It can be configured in the config file.
exclude-timer.conf looks like this below.
<source>
  @type forward
  port 24224
</source>

<match logging-test.timewriter*>
  @type stdout
</match>

<match logging-test.random-number*>
    @type file
    @id output1
    path "/fluentd/log/data.*.log"
    symlink_path "/fluentd/log/data.log"
    append true
</match>
Then, exclude-timer.yml
version: "3.7"

services:
  fluentd:
    environment:
      - FLUENTD_CONF=exclude-timer.conf
Let’s run
$ docker-compose -f docker-compose.yml -f exclude-timer.yml up -d
$ docker container logs docker-logging_fluentd_1
2020-12-08 19:15:43 +0000 [info]: parsing config file is succeeded path="/fluentd/etc/exclude-timer.conf"
2020-12-08 19:15:43 +0000 [info]: gem 'fluentd' version '1.11.5'
2020-12-08 19:15:43 +0000 [info]: using configuration file: <ROOT>
  <source>
    @type forward
    port 24224
  </source>
  <match logging-test.timewriter*>
    @type stdout
  </match>
  <match logging-test.random-number*>
    @type file
    @id output1
    path "/fluentd/log/data.*.log"
    symlink_path "/fluentd/log/data.log"
    append true
    <buffer time>
      path "/fluentd/log/data.*.log"
    </buffer>
  </match>
</ROOT>
2020-12-08 19:15:43 +0000 [info]: starting fluentd-1.11.5 pid=6 ruby="2.7.1"
2020-12-08 19:15:43 +0000 [info]: spawn command to main:  cmdline=["/usr/bin/ruby", "-Eascii-8bit:ascii-8bit", "/usr/bin/fluentd", "-c", "/fluentd/etc/exclude-timer.conf", "-p", "/fluentd/plugins", "--under-supervisor"]
2020-12-08 19:15:44 +0000 [info]: adding match pattern="logging-test.timewriter*" type="stdout"
2020-12-08 19:15:44 +0000 [info]: adding match pattern="logging-test.random-number*" type="file"
2020-12-08 19:15:45 +0000 [info]: adding source type="forward"
2020-12-08 19:15:45 +0000 [info]: #0 starting fluentd worker pid=15 ppid=6 worker=0
2020-12-08 19:15:45 +0000 [info]: #0 listening port port=24224 bind="0.0.0.0"
2020-12-08 19:15:45 +0000 [info]: #0 fluentd worker is now running worker=0
2020-12-08 19:15:53.000000000 +0000 logging-test.timewriter: {"container_name":"/docker-logging_timewriter_1","source":"stdout","log":"2020-11-08 19:15:53.273","container_id":"9671da6f35109a8ddcb4487d9bfee8079d794a5fea2df04168ff5b27f9a60e82"}
2020-12-08 19:15:58.000000000 +0000 logging-test.timewriter: {"container_id":"9671da6f35109a8ddcb4487d9bfee8079d794a5fea2df04168ff5b27f9a60e82","container_name":"/docker-logging_timewriter_1","source":"stdout","log":"2020-11-08 19:15:58.279"}
2020-12-08 19:16:03.000000000 +0000 logging-test.timewriter: {"container_name":"/docker-logging_timewriter_1","source":"stdout","log":"2020-11-08 19:16:03.284","container_id":"9671da6f35109a8ddcb4487d9bfee8079d794a5fea2df04168ff5b27f9a60e82"}
2020-12-08 19:16:08.000000000 +0000 logging-test.timewriter: {"container_id":"9671da6f35109a8ddcb4487d9bfee8079d794a5fea2df04168ff5b27f9a60e82","container_name":"/docker-logging_timewriter_1","source":"stdout","log":"2020-11-08 19:16:08.289"}
2020-12-08 19:16:13.000000000 +0000 logging-test.timewriter: {"container_id":"9671da6f35109a8ddcb4487d9bfee8079d794a5fea2df04168ff5b27f9a60e82","container_name":"/docker-logging_timewriter_1","source":"stdout","log":"2020-11-08 19:16:13.293"}
The output to the stdout was only for timewriter. The log for random-number was written to a file.
2020-12-08T19:15:49+00:00    logging-test.random-number:v1   {"container_name":"/docker-logging_random-number_1","source":"stdout","log":"count: 2, value: 62","container_id":"b4185af95c4ae58a1a0075c52f869ea149600bbcd49d798b225ecac64df7be5f"}
2020-12-08T19:15:52+00:00    logging-test.random-number:v1   {"container_id":"b4185af95c4ae58a1a0075c52f869ea149600bbcd49d798b225ecac64df7be5f","container_name":"/docker-logging_random-number_1","source":"stdout","log":"count: 3, value: 52"}
2020-12-08T19:15:55+00:00    logging-test.random-number:v1   {"container_name":"/docker-logging_random-number_1","source":"stdout","log":"count: 4, value: 47","container_id":"b4185af95c4ae58a1a0075c52f869ea149600bbcd49d798b225ecac64df7be5f"}
2020-12-08T19:15:58+00:00    logging-test.random-number:v1   {"container_id":"b4185af95c4ae58a1a0075c52f869ea149600bbcd49d798b225ecac64df7be5f","container_name":"/docker-logging_random-number_1","source":"stdout","log":"count: 5, value: 86"}
2020-12-08T19:16:01+00:00    logging-test.random-number:v1   {"source":"stdout","log":"count: 6, value: 81","container_id":"b4185af95c4ae58a1a0075c52f869ea149600bbcd49d798b225ecac64df7be5f","container_name":"/docker-logging_random-number_1"}
2020-12-08T19:16:04+00:00    logging-test.random-number:v1   {"container_id":"b4185af95c4ae58a1a0075c52f869ea149600bbcd49d798b225ecac64df7be5f","container_name":"/docker-logging_random-number_1","source":"stdout","log":"count: 7, value: 14"}
2020-12-08T19:16:07+00:00    logging-test.random-number:v1   {"container_id":"b4185af95c4ae58a1a0075c52f869ea149600bbcd49d798b225ecac64df7be5f","container_name":"/docker-logging_random-number_1","source":"stdout","log":"count: 8, value: 60"}
2020-12-08T19:16:10+00:00    logging-test.random-number:v1   {"log":"count: 9, value: 98","container_id":"b4185af95c4ae58a1a0075c52f869ea149600bbcd49d798b225ecac64df7be5f","container_name":"/docker-logging_random-number_1","source":"stdout"}
2020-12-08T19:16:13+00:00    logging-test.random-number:v1   {"log":"count: 10, value: 17","container_id":"b4185af95c4ae58a1a0075c52f869ea149600bbcd49d798b225ecac64df7be5f","container_name":"/docker-logging_random-number_1","source":"stdout"}
2020-12-08T19:16:16+00:00    logging-test.random-number:v1   {"source":"stdout","log":"count: 11, value: 94","container_id":"b4185af95c4ae58a1a0075c52f869ea149600bbcd49d798b225ecac64df7be5f","container_name":"/docker-logging_random-number_1"}
Store log data into Elasticsearch
We could collect all log information to Fluentd but we want a way to visualize it. Let’s use Elasticsearch as no-SQL document database to store the collected logs. We need to use a plugin for it but the Docker image of Fluentd doesn’t include the plugin. Therefore, we need to add it by ourselves. It’s described how to do it in Docker-Hub.
Install elasticsearch plugin
I almost copied and pasted it but I specified the version 4.3.2.
FROM fluent/fluentd:v1.11-1

# Use root account to use apk
USER root

# below RUN includes plugin as examples elasticsearch is not required
# you may customize including plugins as you wish
RUN apk add --no-cache --update --virtual .build-deps \
        sudo build-base ruby-dev \
 && sudo gem install fluent-plugin-elasticsearch -v 4.3.2 \
 && sudo gem sources --clear-all \
 && apk del .build-deps \
 && rm -rf /tmp/* /var/tmp/* /usr/lib/ruby/gems/*/cache/*.gem

USER fluent
I built the image.
cd Docker/images/fluentd/
docker image build -t fluentd .
Start containers with elasticsearch
When I just pull the image from Docker-Hub and run it it failed to start because of following errors.
ERROR: [2] bootstrap checks failed
[1]: max virtual memory areas vm.max_map_count [65530] is too low, increase to at least [262144]
[2]: the default discovery settings are unsuitable for production use; at least one of [discovery.seed_hosts, discovery.seed_providers, cluster.initial_master_nodes] must be configured
ERROR: Elasticsearch did not exit normally - check the logs at /usr/share/elasticsearch/logs/docker-cluster.log
Solution would be either to run it in dev mode or increase the value of vm.max_map_count. This is only for a trial and I don’t need to run it in production mode. To run it in dev mode, I set it according to the manual.
The elasticsearch.yml looks like this.
version: "3.7"

services:
  fluentd:
    image: fluentd
    environment:
      - FLUENTD_CONF=elasticsearch.conf

  elasticsearch:
    image: elasticsearch:7.9.3
    environment:
      - discovery.type=single-node
    ports:
      - "9200:9200"
      - "9300:9300"
elasticsearch.conf looks like this below. It took a while to recognize that I set localhost to host parameter. It didn’t work because it was running in a container and localhost is container itself. Even though the elasticsearch can be accessed by localhost:9200 from host machine other containers cannot access there by localhost.
<source>
  @type forward
  port 24224
</source>

<match *.**>
  @type copy
  <store>
    @type elasticsearch
    host elasticsearch
    port 9200
    include_tag_key true
    tag_key @log_name
    logstash_format true
    flush_interval 10s
  </store>
</match>
We can confirm if elasticsearch and fluentd are working as expected. It takes a while until elasticsearch is ready.
docker-compose -f docker-compose.yml -f elasticsearch.yml up -d
docker container logs docker-logging_fluentd_1
If following error messages are shown you need to check the host and port settings.
2020-12-10 21:04:45 +0000 [warn]: #0 Remaining retry: 14. Retry to communicate after 2 second(s).
2020-12-10 21:04:49 +0000 [warn]: #0 Could not communicate to Elasticsearch, resetting connection and trying again. Address not available - connect(2) for [::1]:9200 (Errno::EADDRNOTAVAIL)
2020-12-10 21:04:49 +0000 [warn]: #0 Remaining retry: 13. Retry to communicate after 4 second(s).
2020-12-10 21:04:57 +0000 [warn]: #0 Could not communicate to Elasticsearch, resetting connection and trying again. Address not available - connect(2) for [::1]:9200 (Errno::EADDRNOTAVAIL)
2020-12-10 21:04:57 +0000 [warn]: #0 Remaining retry: 12. Retry to communicate after 8 second(s).
2020-12-10 21:05:13 +0000 [warn]: #0 Could not communicate to Elasticsearch, resetting connection and trying again. Address not available - connect(2) for [::1]:9200 (Errno::EADDRNOTAVAIL)
Let’s check if the log data is sent to elasticsearch correctly. You can see the data with json format.
# Check the index
curl http://localhost:9200/_aliases?pretty
I could find following entry.
  "logstash-2020.12.10" : {
    "aliases" : { }
  },
"logstash-2020.12.10" is the index where we need to use to check stored data.
curl http://localhost:9200/logstash-2020.12.10/_search?prettyI could find following entries. It looked working as expected.
      {
        "_index" : "logstash-2020.12.10",
        "_type" : "_doc",
        "_id" : "fOGGTnYBIvtnLEfpeUpt",
        "_score" : 1.0,
        "_source" : {
          "log" : "count: 227, value: 92",
          "container_id" : "6531f13e633ef5bfface6572edfecf01cfb33fa512765e9159484a7d225c92b5",
          "container_name" : "/docker-logging_random-number_1",
          "source" : "stdout",
          "@timestamp" : "2020-12-10T21:20:03.000000000+00:00",
          "@log_name" : "logging-test.random-number:v1"
        }
      },
      {
        "_index" : "logstash-2020.12.10",
        "_type" : "_doc",
        "_id" : "gOGGTnYBIvtnLEfpmEpu",
        "_score" : 1.0,
        "_source" : {
          "log" : "2020-11-10 21:20:02.373",
          "container_id" : "3a33252e13da844b8dbf4d8ced66502d07e942cc584cfc93ca79f3fb6a5d75a7",
          "container_name" : "/docker-logging_timewriter_1",
          "source" : "stdout",
          "@timestamp" : "2020-12-10T21:20:02.000000000+00:00",
          "@log_name" : "logging-test.timewriter"
        }
      },
Setup Kibana and see the log info
Let’s setup Kibana container to visualize the log data. I use default setup. The docker compose file looks like this. It’s very simple.
version: "3.7"

services:
  kibana:
    image: kibana:7.9.3
    ports:
      - "5601:5601"
Let’s run Kibana with Elasticsearch!
docker-compose -f docker-compose.yml -f elasticsearch.yml -f kibana.yml up -dIt takes a while to be ready (1 or 2 minutes?). We can access to the web page with http://localhost:5601/. At the top left three line mark, there is Discover menu. We need to
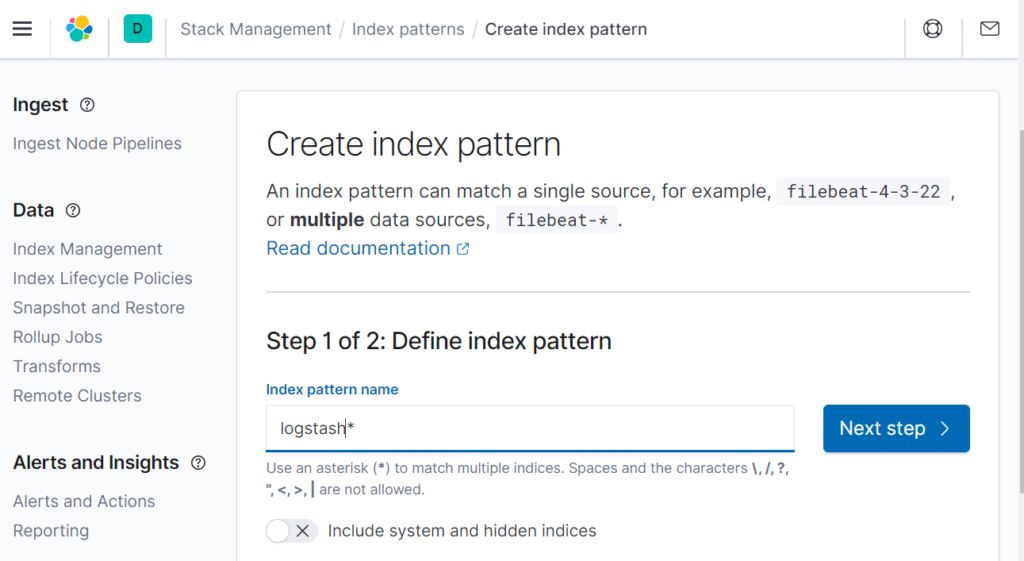
define index pattern. Since I didn’t define logstash_prefix in elasticsearch.conf the name is default. Input logstash* because the log info that the applications sends has the logstash prefix.
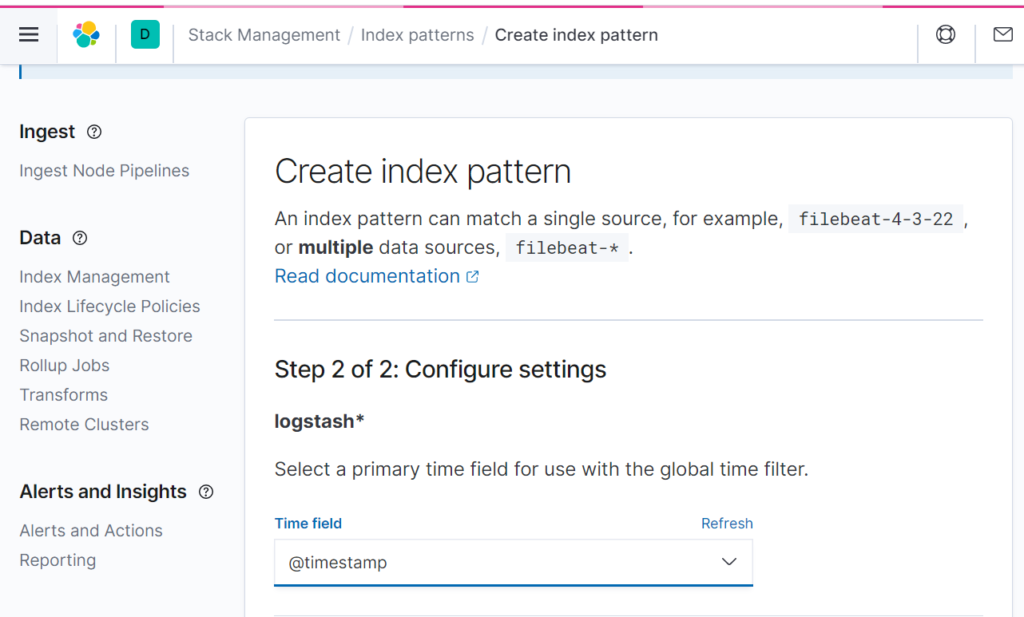
Then, next step. Select @timestamp.
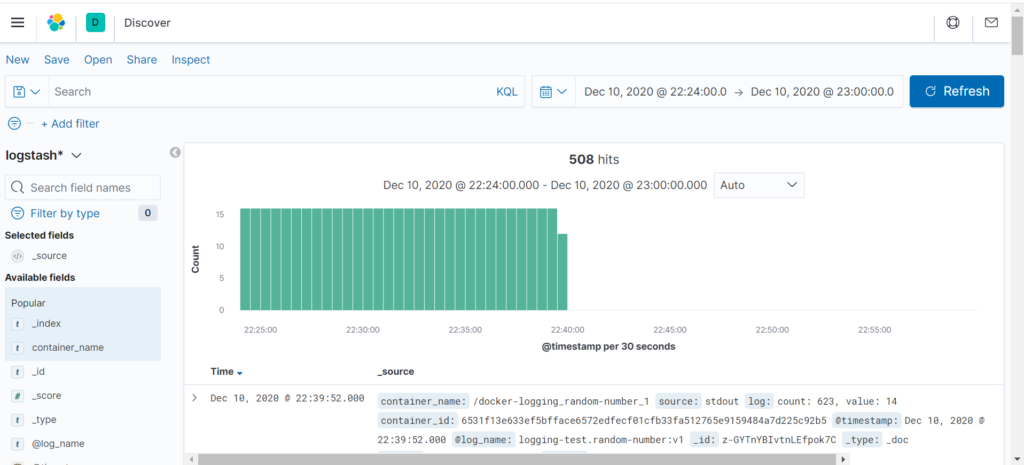
We could visualize the data! It looks that Kibana offers many functionalities.
Conclusion
If we collect all logs from Docker container to elasticsearch via fluentd we can analyse the info in Kibana. Even if we don’t have clear picture at the moment it can be useful in the future because of variety of functionalities. This is start point and we need to check what we can do with Kibana if it’s used in production.


Comments