
It’s hard to find the root cause of a memory leak. It’s not a good way to start reading code to find it without any clue. We should first profile the application to know which object is not released.
My application runs with Node.js, C++ (nan), and C# (Edge.js). I could find a way to profile only for Node.js but not for the combination. That’s why I write this article.
Let’s do the profiling in the following way.
Profile Node.js application
Enable profiling and manual garbage collection
To enable profiling, --inspect option needs to be added when running node.
node --inspect app.jsI think it’s better to add --expose-gc option too. With this option, we can manually call garbage collection.
node --expose-gc --inspect app.jsThen, we can call garbage collection every second if necessary by adding the following code somewhere.
global.setInterval(() => {
global.gc();
console.log("gc() was called.");
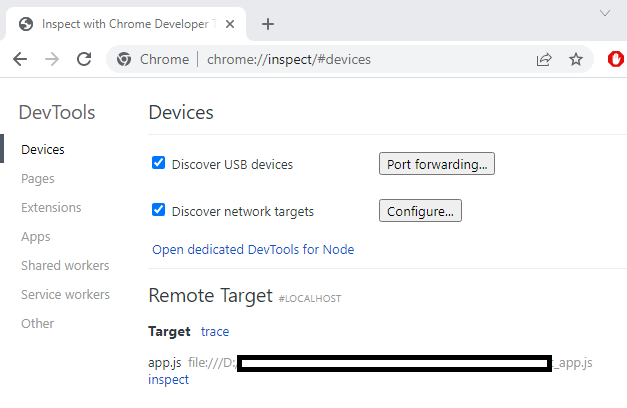
}, 1000);Open Chrome browser and input chrome://inspect/ into the address bar once the application starts with --inspect option. DevTools screen is open. Click inspect.
Create Dump snapshot 3 times
We have to know which objects are created but not released. For this reason, we need 3 dump snapshots.
I recommend to check Include numerical values in capture for deeper investigation. A snapshot is created by clicking Take snapshot.
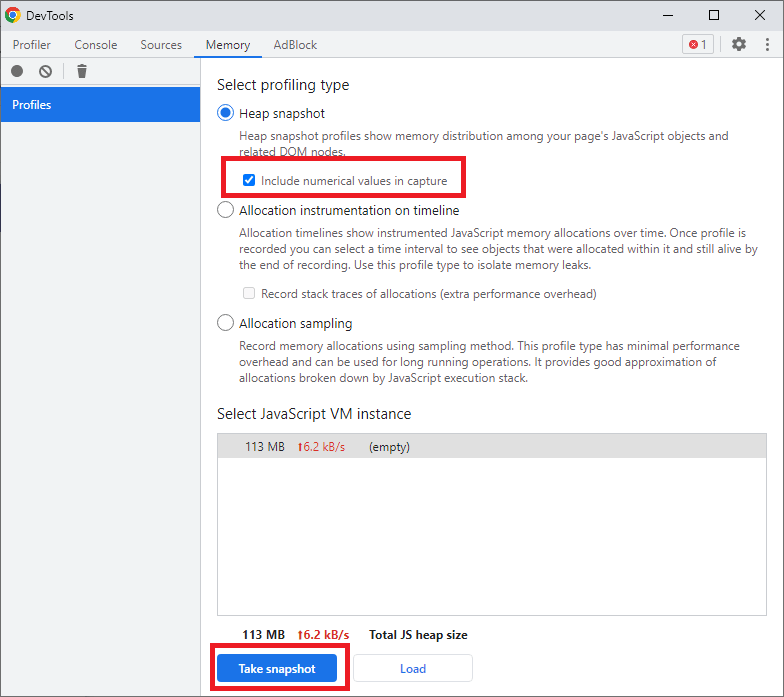
We can see all objects in the snapshot.
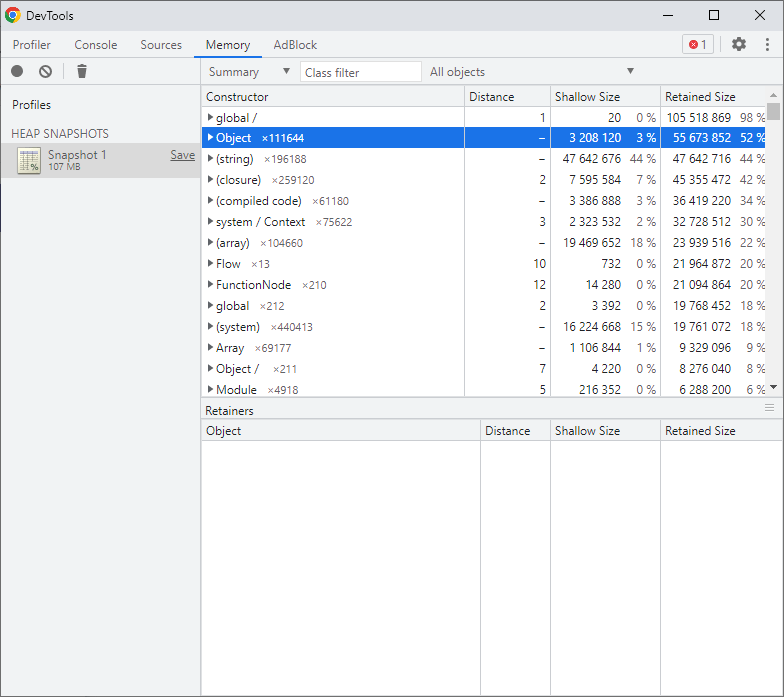
But we need additional 2 snapshots to know which objects are not released. Run the application with the necessary operations for the memory leak. Then, click Take snapshot to create two snapshots.
Compare the snapshots
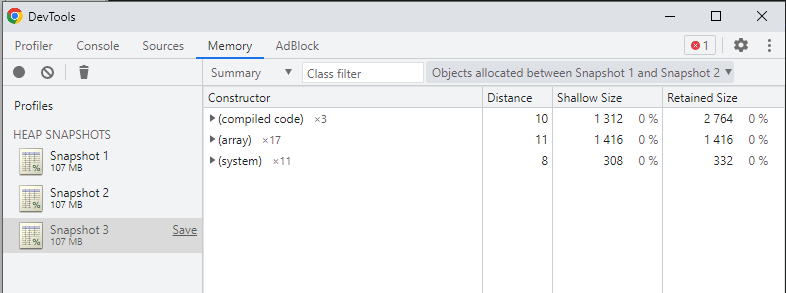
Select the third snapshot on left side and select Objects allocated between Snapshot1 and Snapshot2.
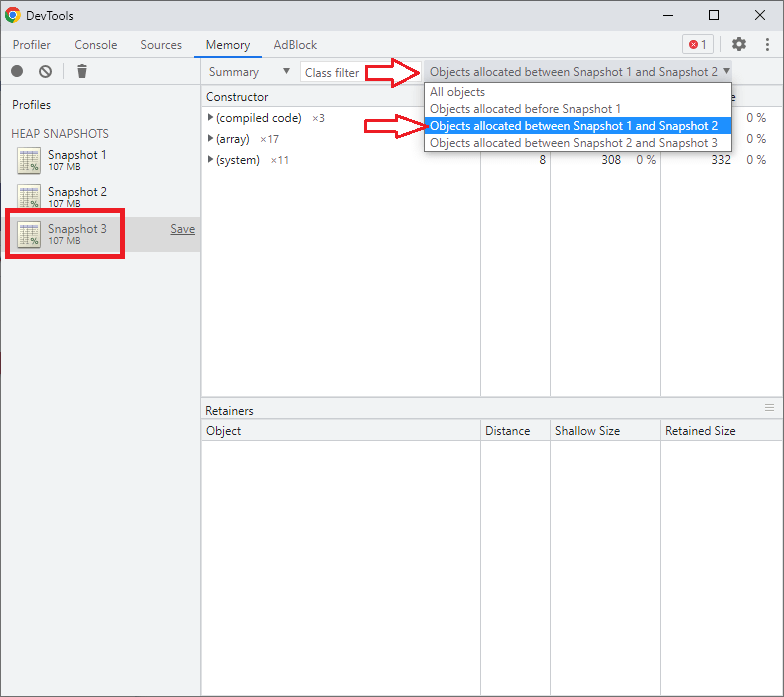
Basically, non-released objects are shown there but if the object is wrapped with parentheses for example (array) in the following image, it’s better to skip for the first look.
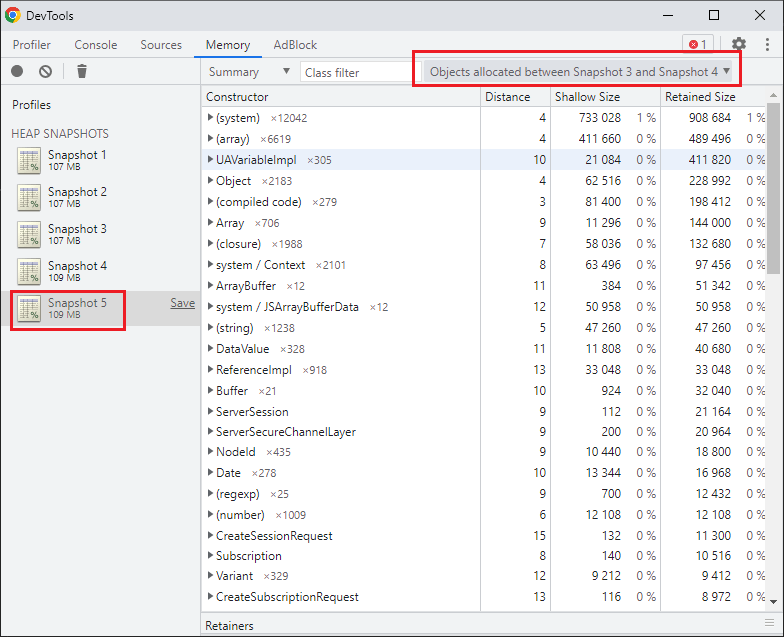
If it doesn’t contain the known object names, create additional snapshots. Then, select Objects allocated between Snapshot3 and Snapshot4 for example.
If it contains known object names, we can expand the object to see the target code. We can also check the target code when clicking the file name.
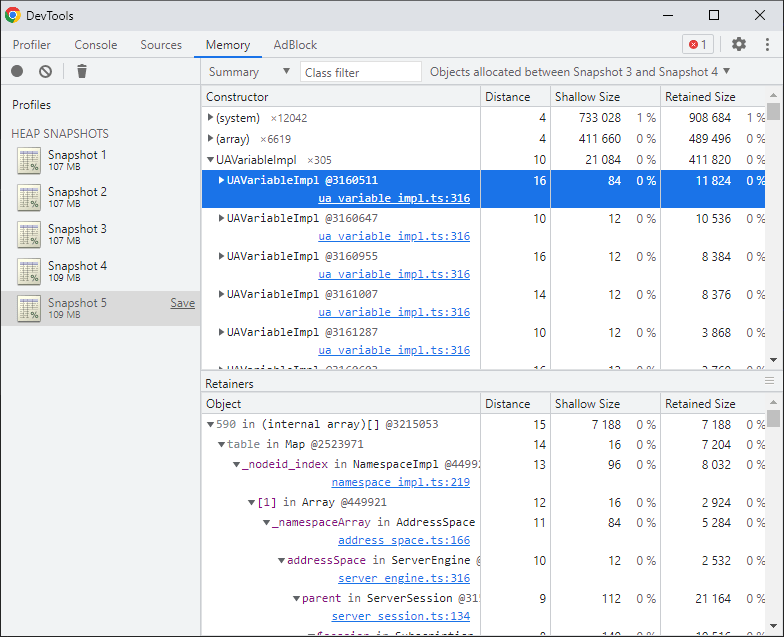
Those objects might need to be stored without GC. We have to carefully check what the objects and the code do. However, it gives us a good point where we can start the investigation.
Node.js profiler shows only JavaScript related objects
It seems that the profiler shows only JavaScript-related objects. As you can see in the following image, the memory usage is different from the one on the Task Manager.
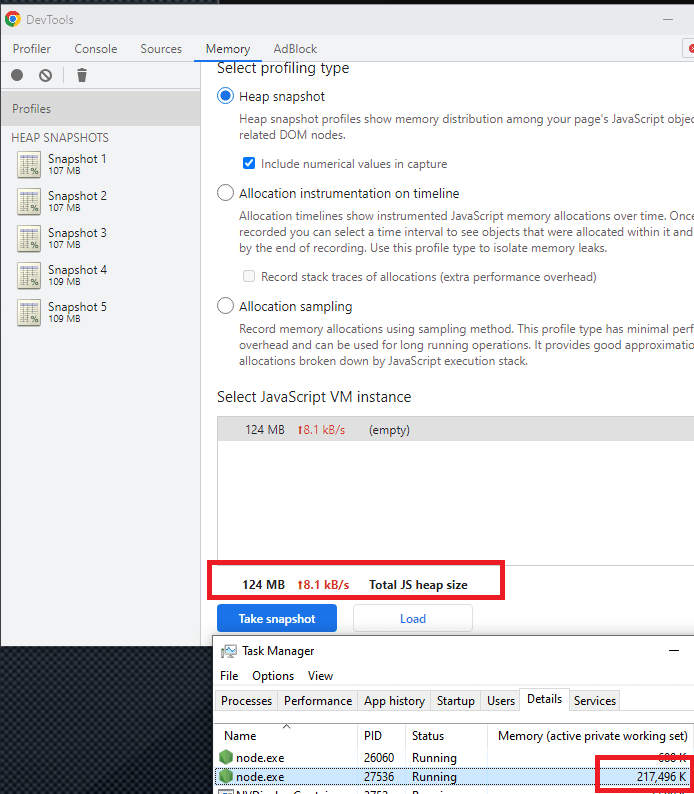
In this case, the memory leak occurs in C+/C# code.
Profile C# code (DLL) with Visual Studio 2019
Node.js application can use C# code. I use Edge.js for the wrapper. The C# code can’t be profiled in the profiler above. So I used Visual Studio 2019.
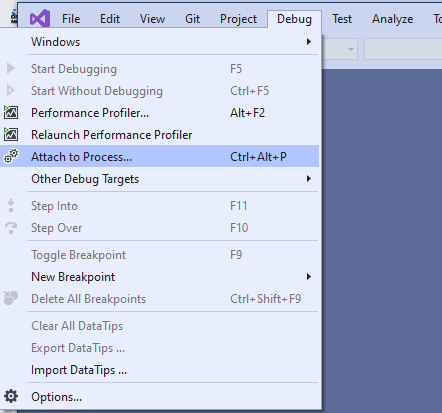
Go to Debug > Attach to Process
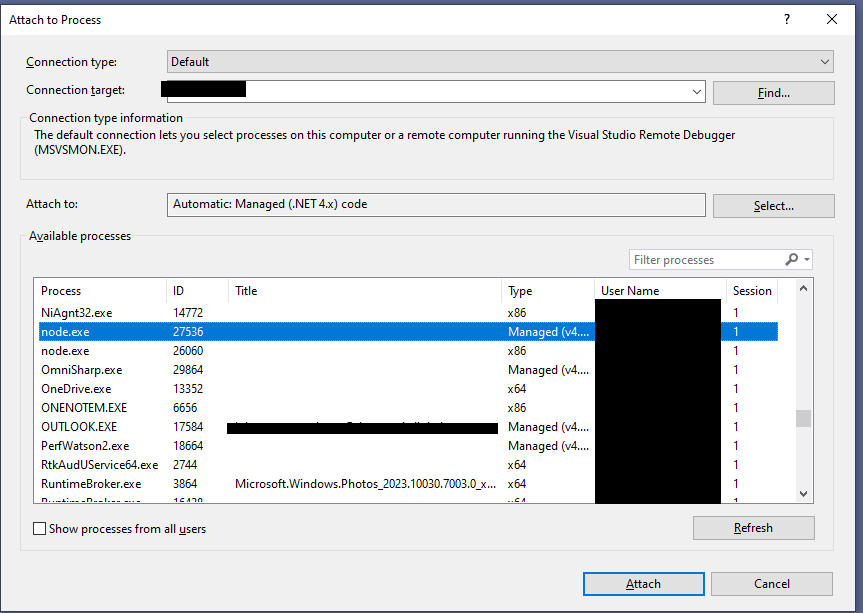
Then, select the desired node.exe.
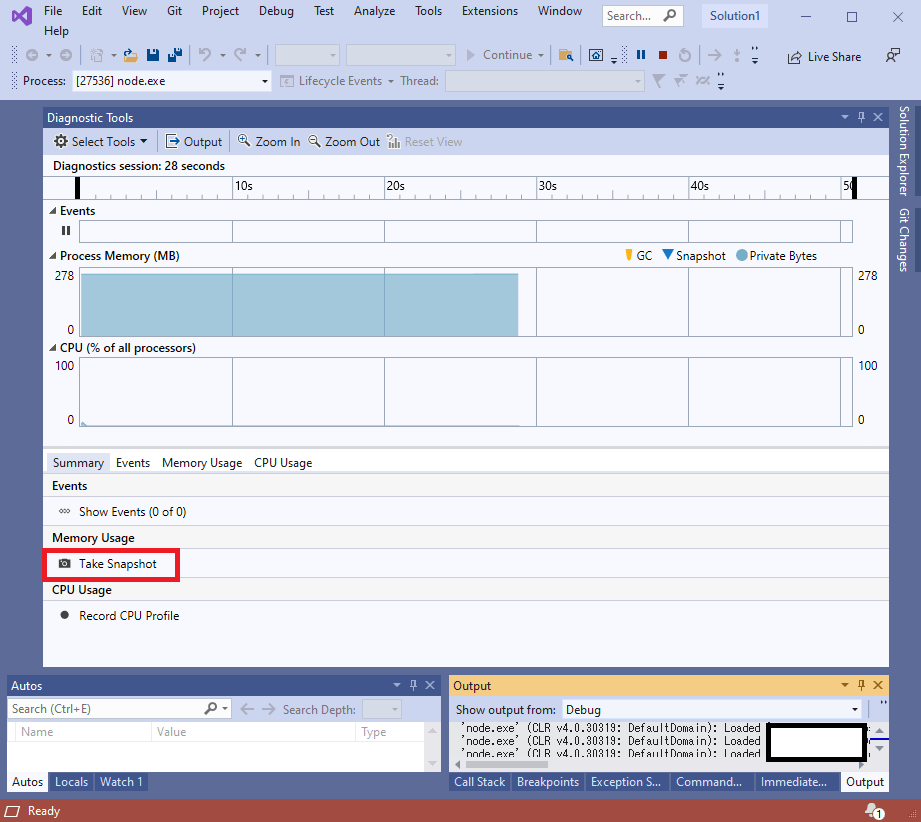
Click Take Snapshot. Do some operation with the application for the memory leak and create some snapshots.
By creating multiple snapshots, we can see whether the Heap size increases or not. We can check the diff by clicking somewhere for example Diff.
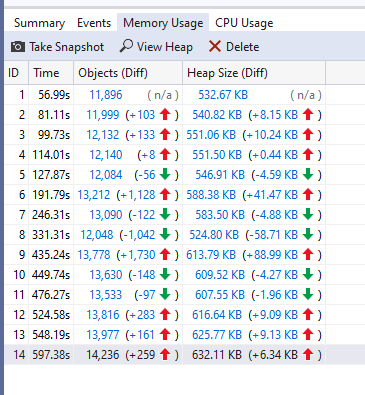
Then, it shows that the ThreadPoolWorkQueue increases.
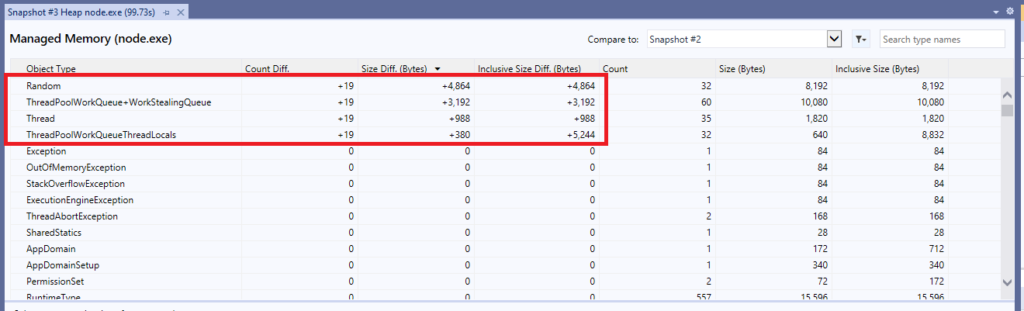
The function is processed exclusively by the lock mechanism and the function is called by Task.run() to make the function call async.
lock(object){
    // do something here
}
It seems that the function is called before the previous process is done and thus the new tasks are added to the queue in my case.
If the data between the two snapshots is not enough to investigate, create additional snapshots and compare them. The diff becomes bigger if the duration between the two snapshots is big.
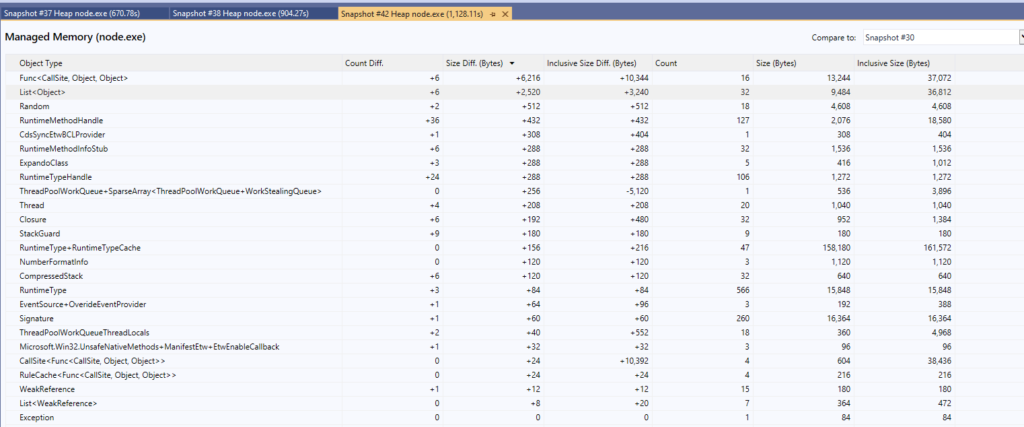
The tool shows class names where the objects are created. It helps us finding the root cause.


Comments